What happened at this address? Answered two ways.
Citation Wx turns raw atmospheric data into source-cited weather reports for a specific property and time window — a storm history in seconds, or a full meteorological analysis in minutes. Built for the moments a property claim turns on what the weather actually did.
Run reports from the field, or the desk.
The same account, reports, and pricing everywhere. Order a report at the property from your phone; work the full analysis on the Mac app.
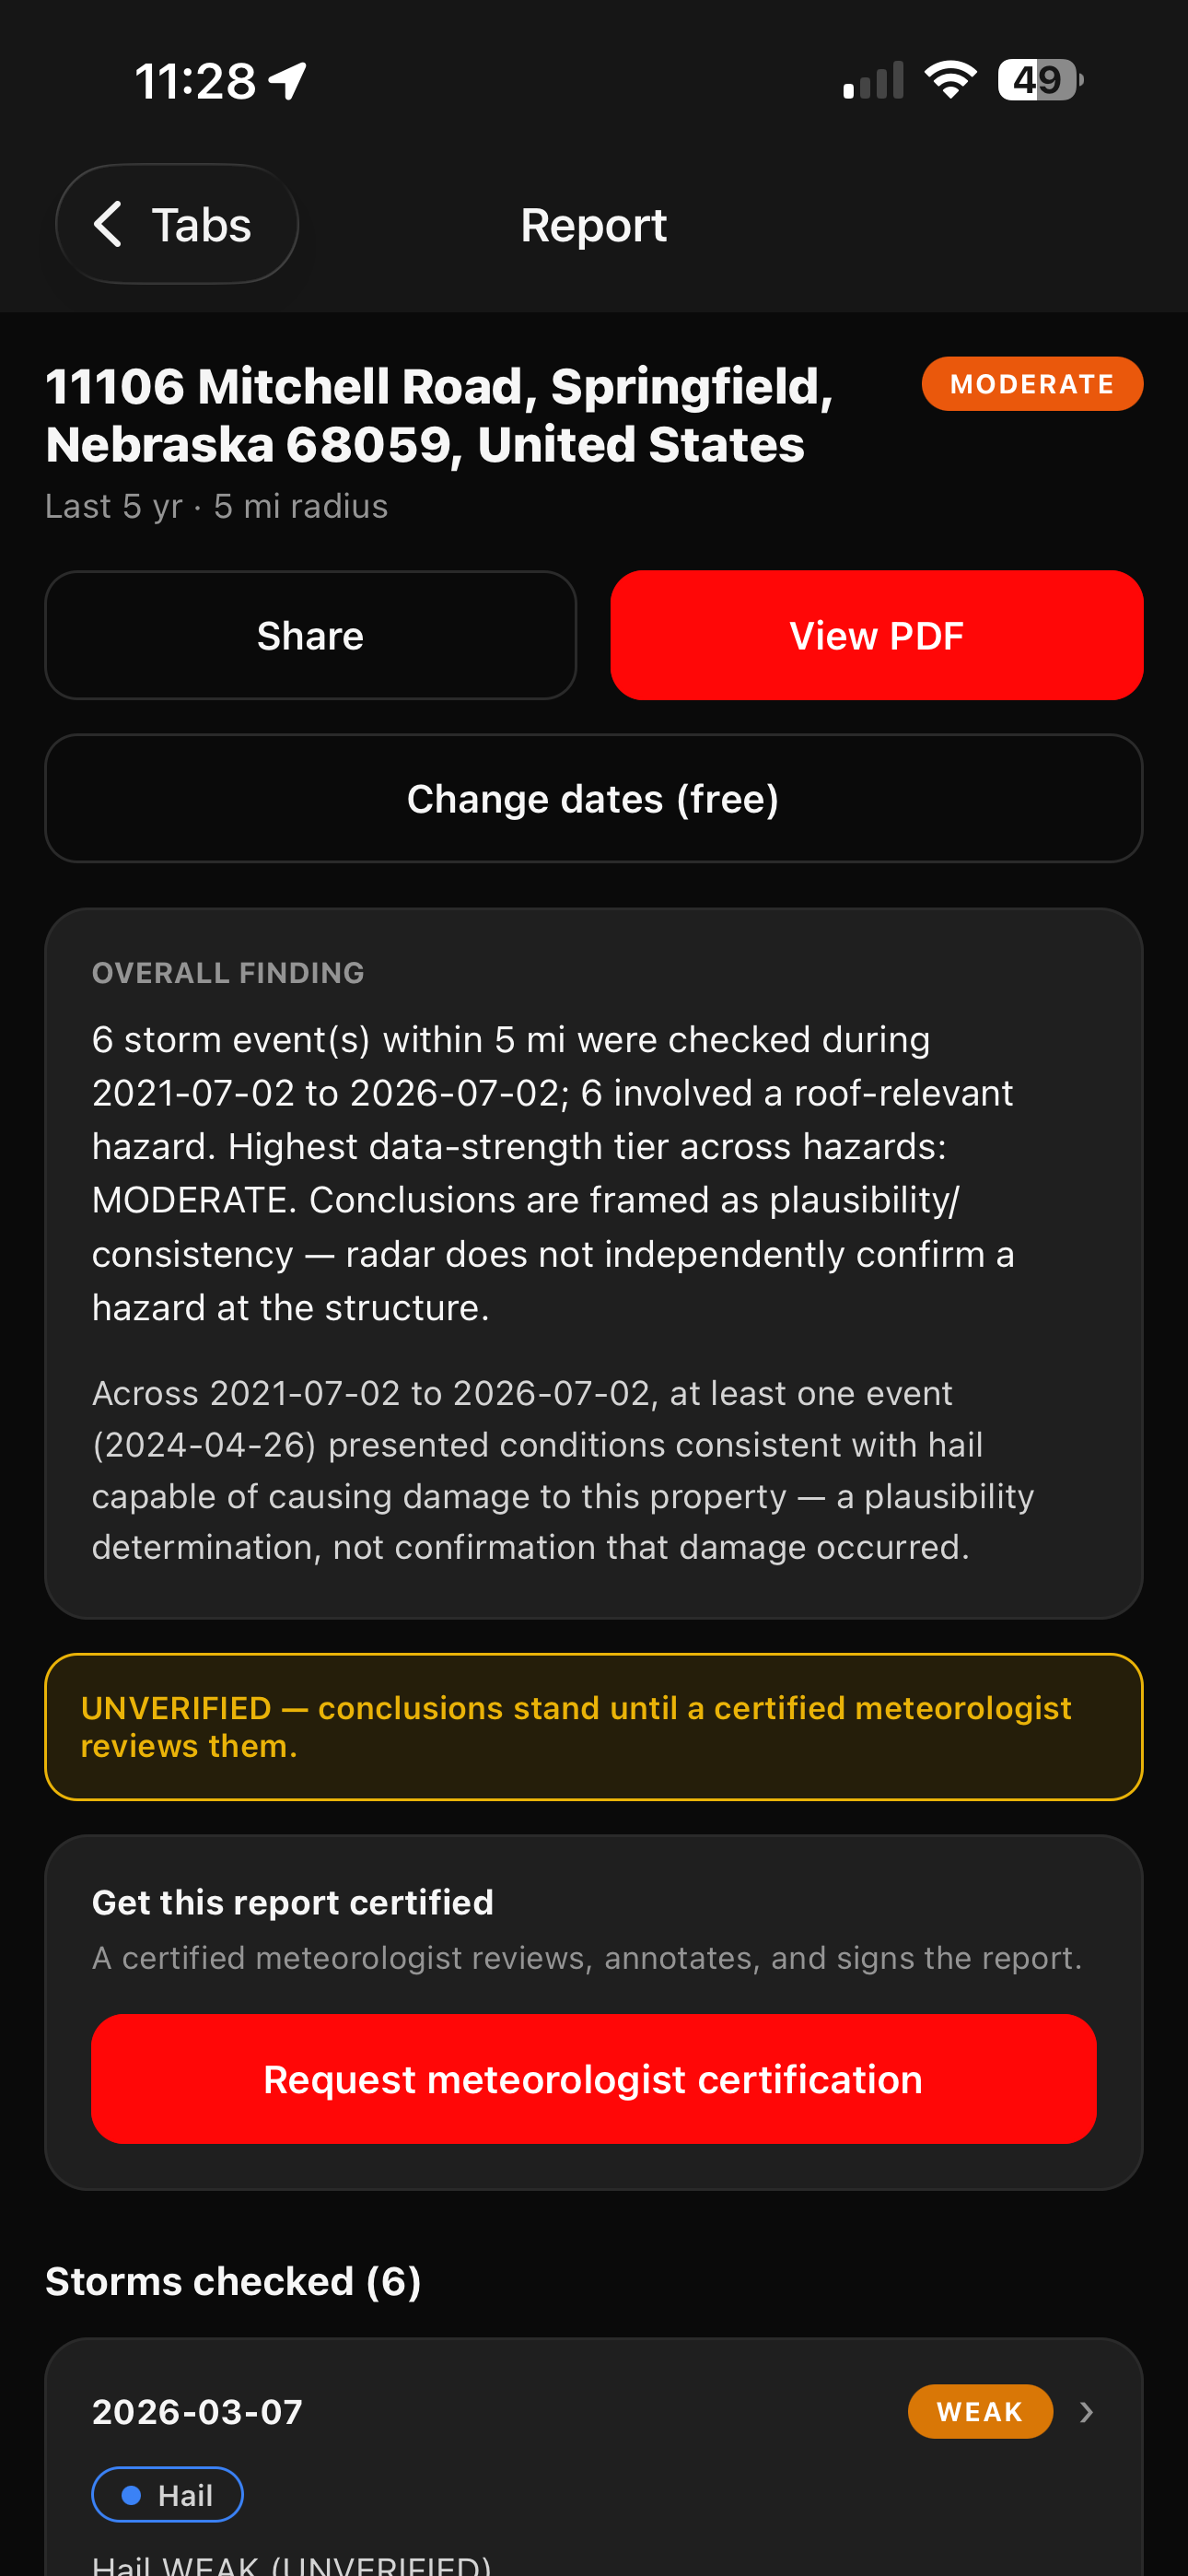
Three reports. One source of truth.
A history of the storm events already on record near the property in your chosen window, each linked to its official source. A neutral, factual list — no per-hazard analysis.
A full meteorological work-up of the storms on record near the property: a scored summary for every storm, each opening into a deeper analysis of whether damage from that event is plausible and consistent with the record.
For one claimed date of loss with no storm event on the official record. Rather than starting from a logged event, it reconstructs the day from the raw archive to show what the record supports for that property on that date.
A source-cited storm history, in seconds.
Enter an address and a time window. In seconds you get every storm event on record near the parcel — each row linked straight to its official source, tagged MEASURED or ESTIMATE, with its distance. It documents what was reported; it makes no claim that any event caused damage.
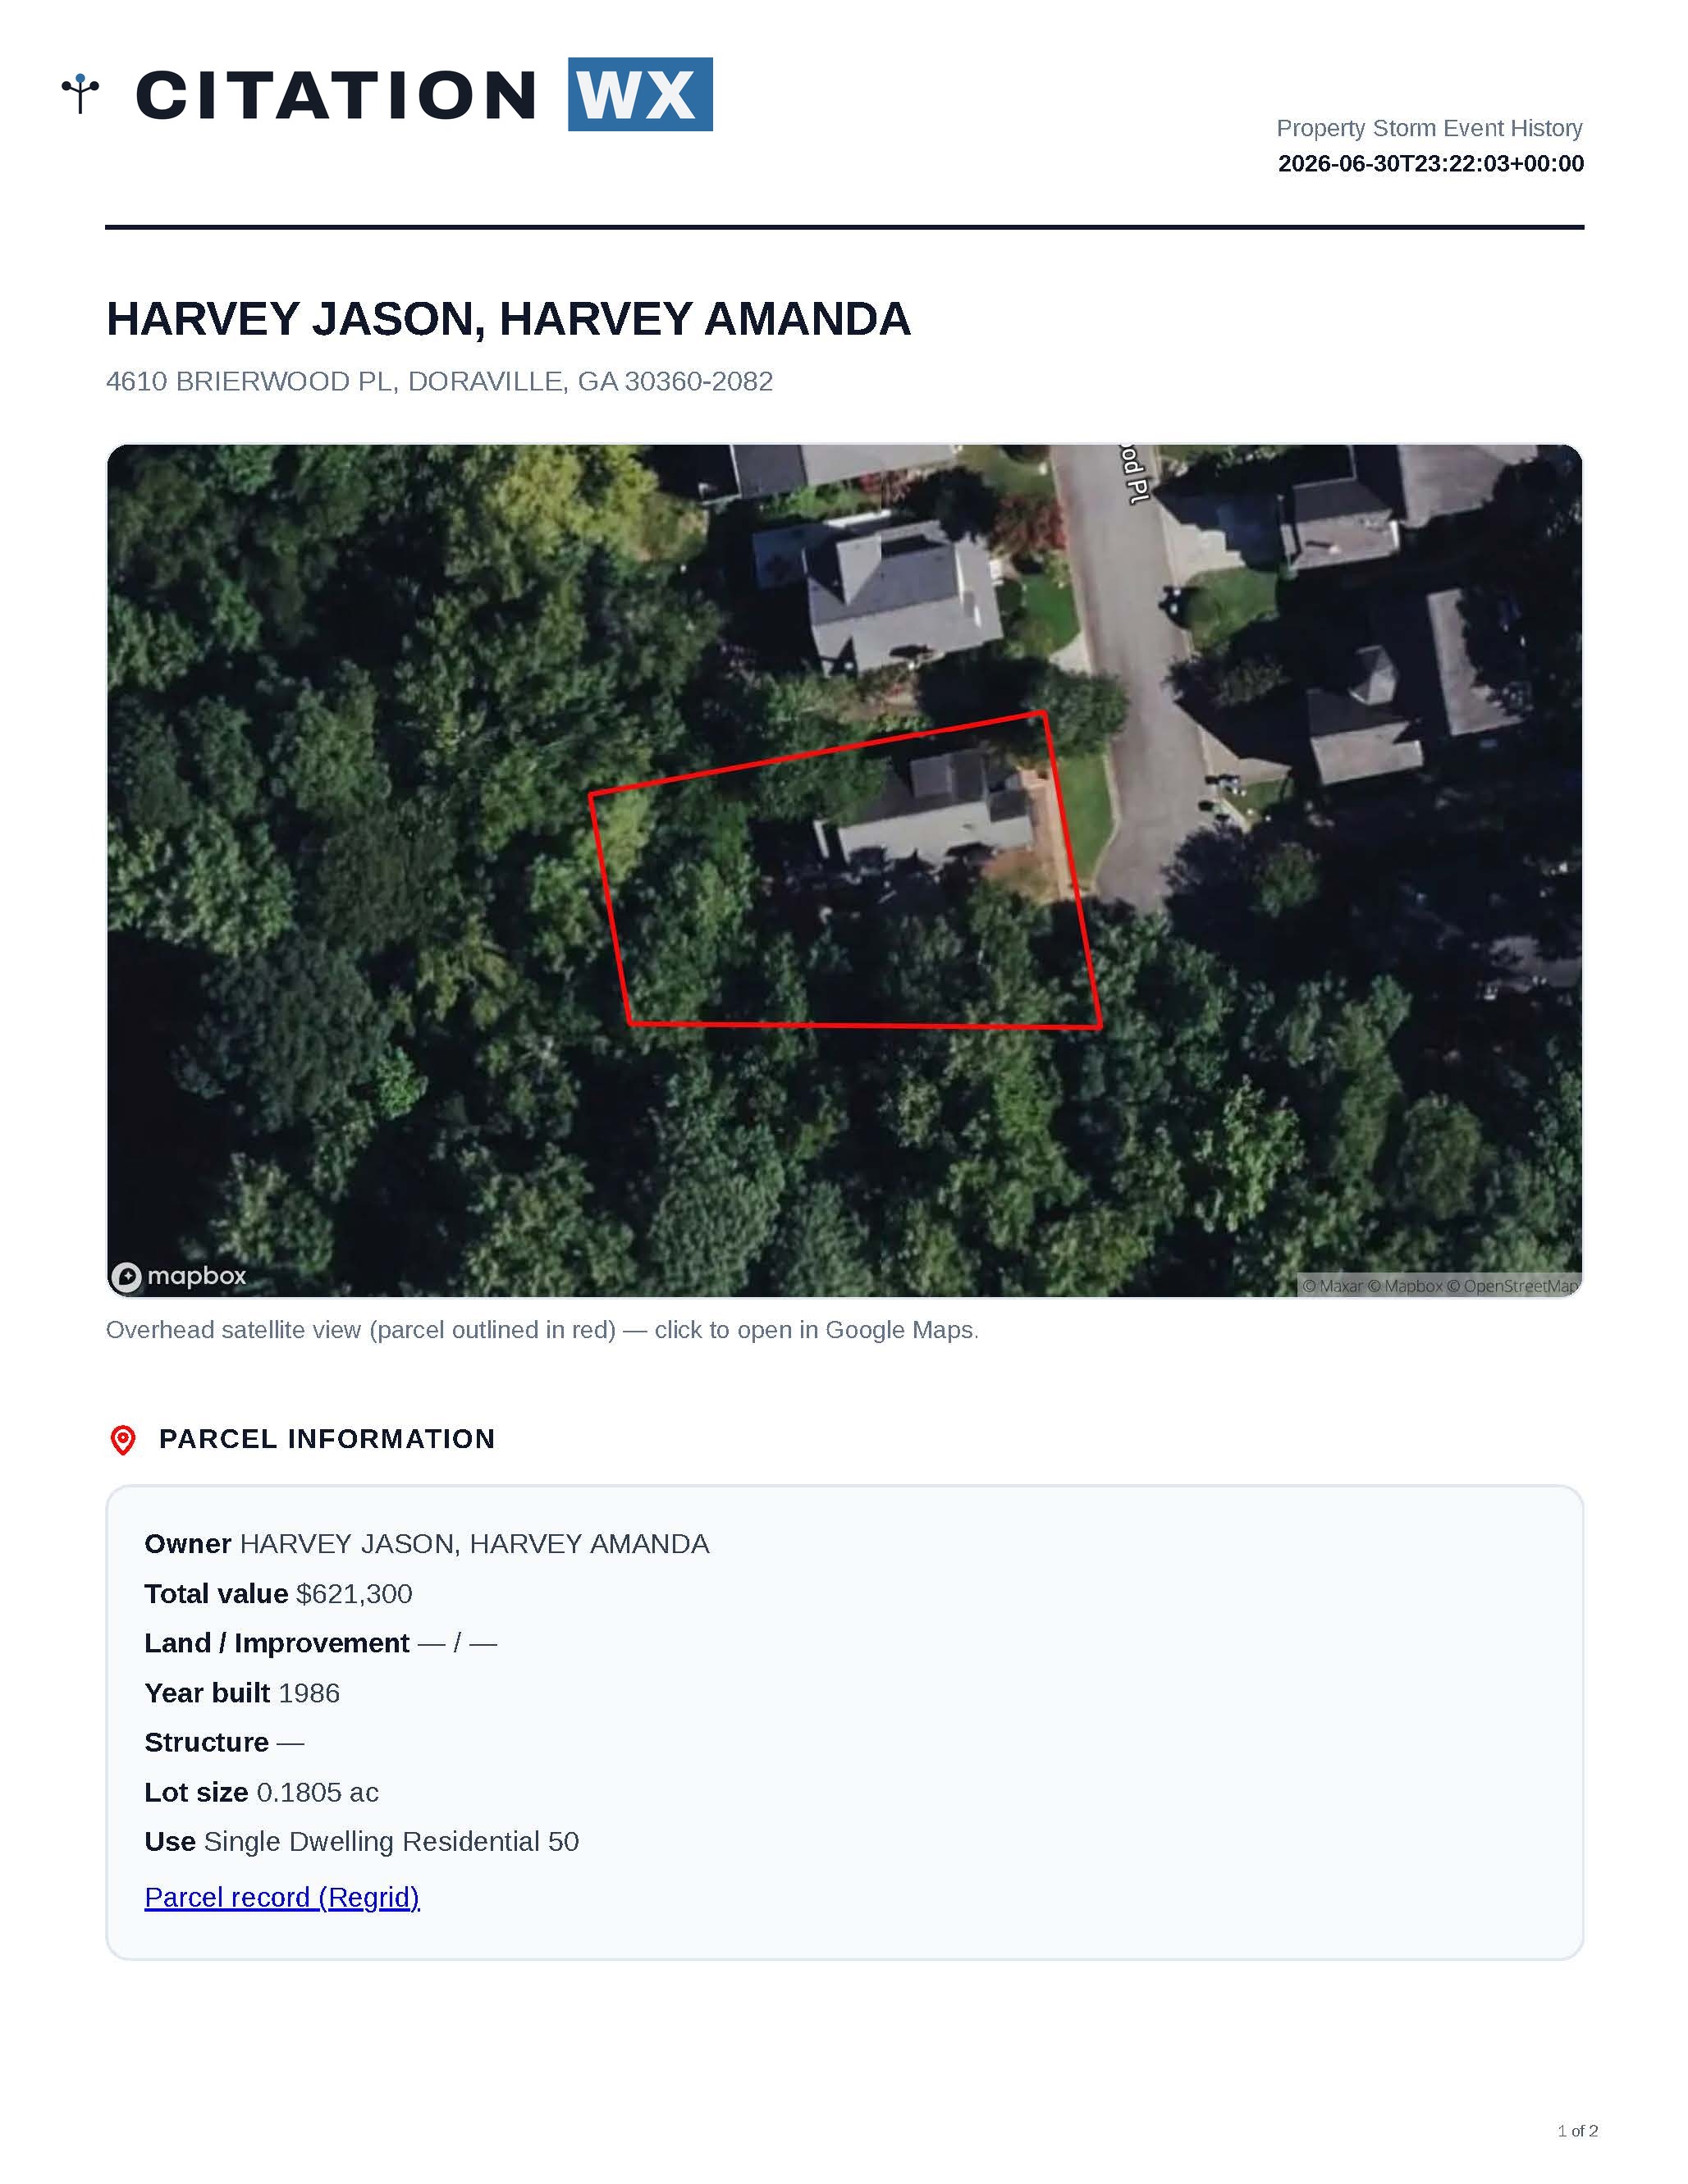
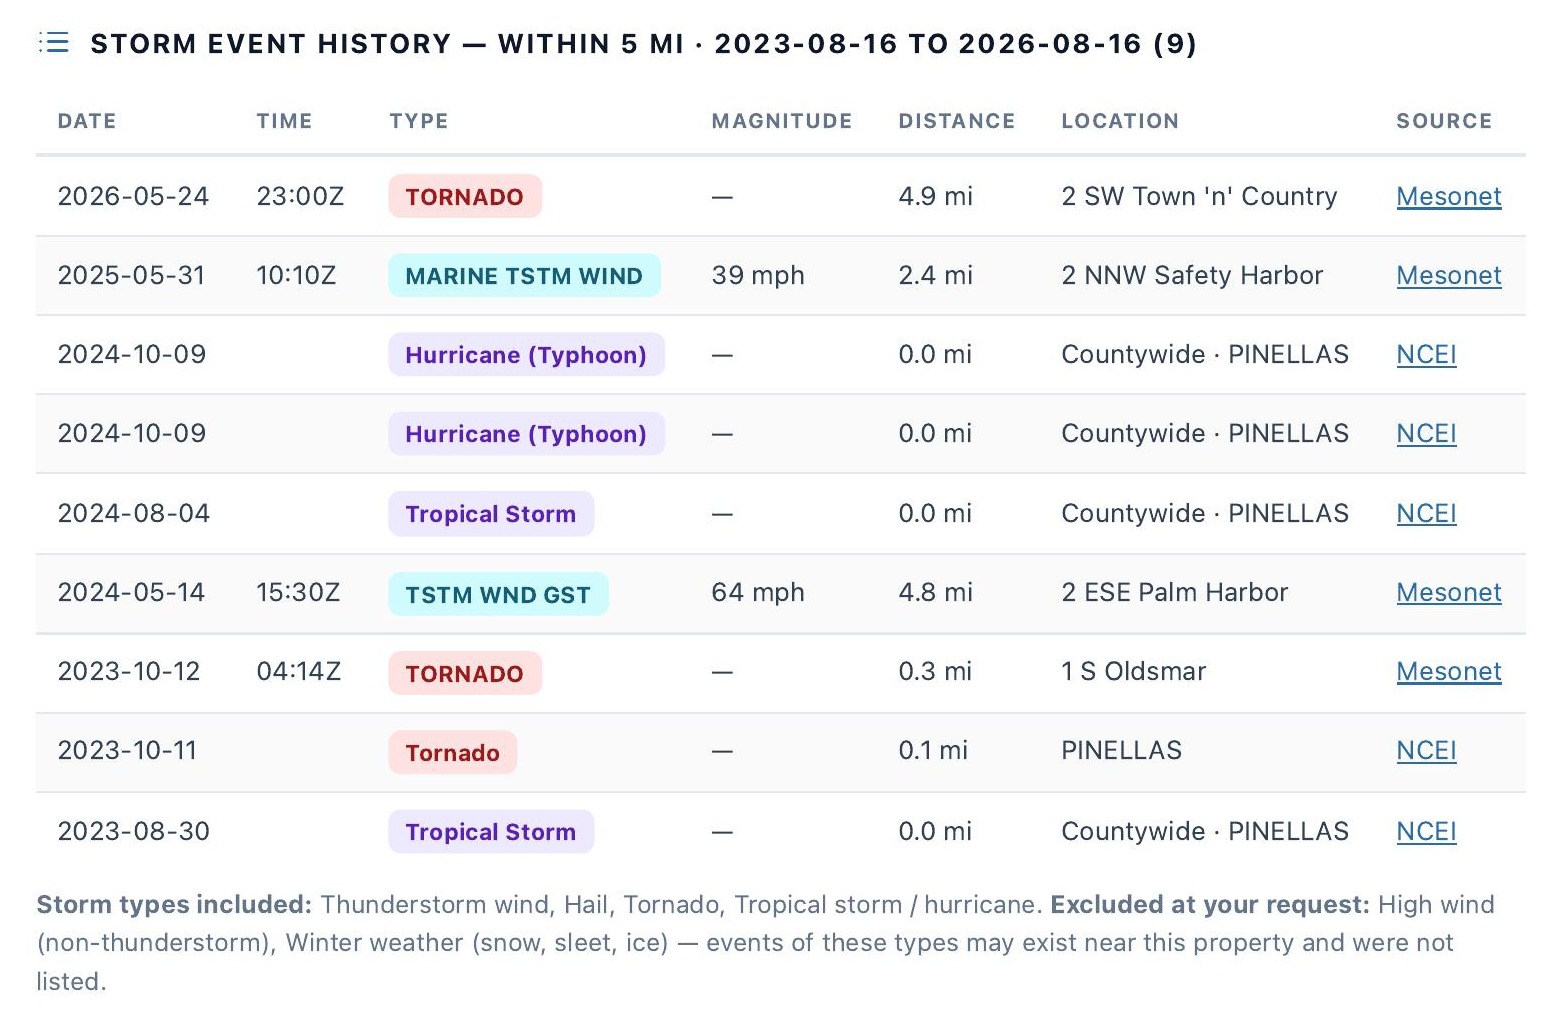
A storm history you can drill into.
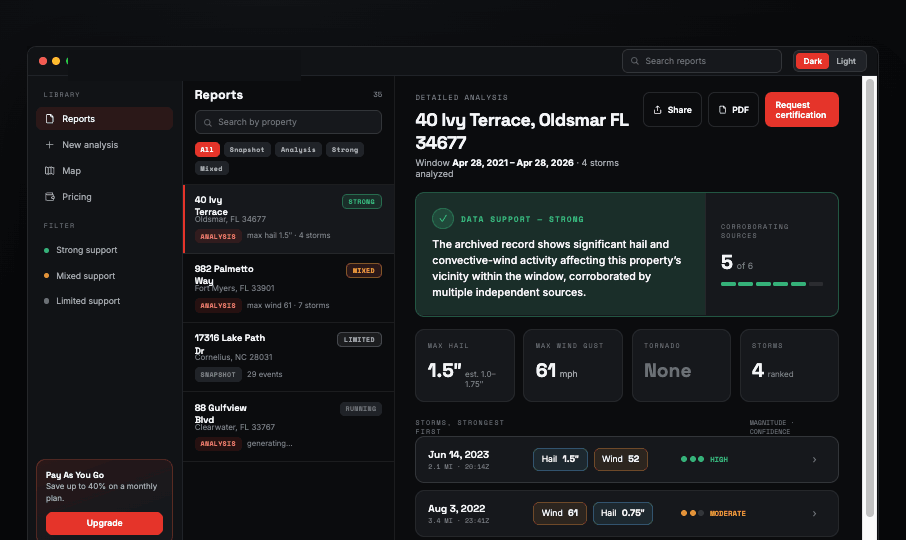
The report opens with every storm checked at the property — scored and summarized. From any storm, open its per-storm breakout: a full meteorological analysis of that single event.
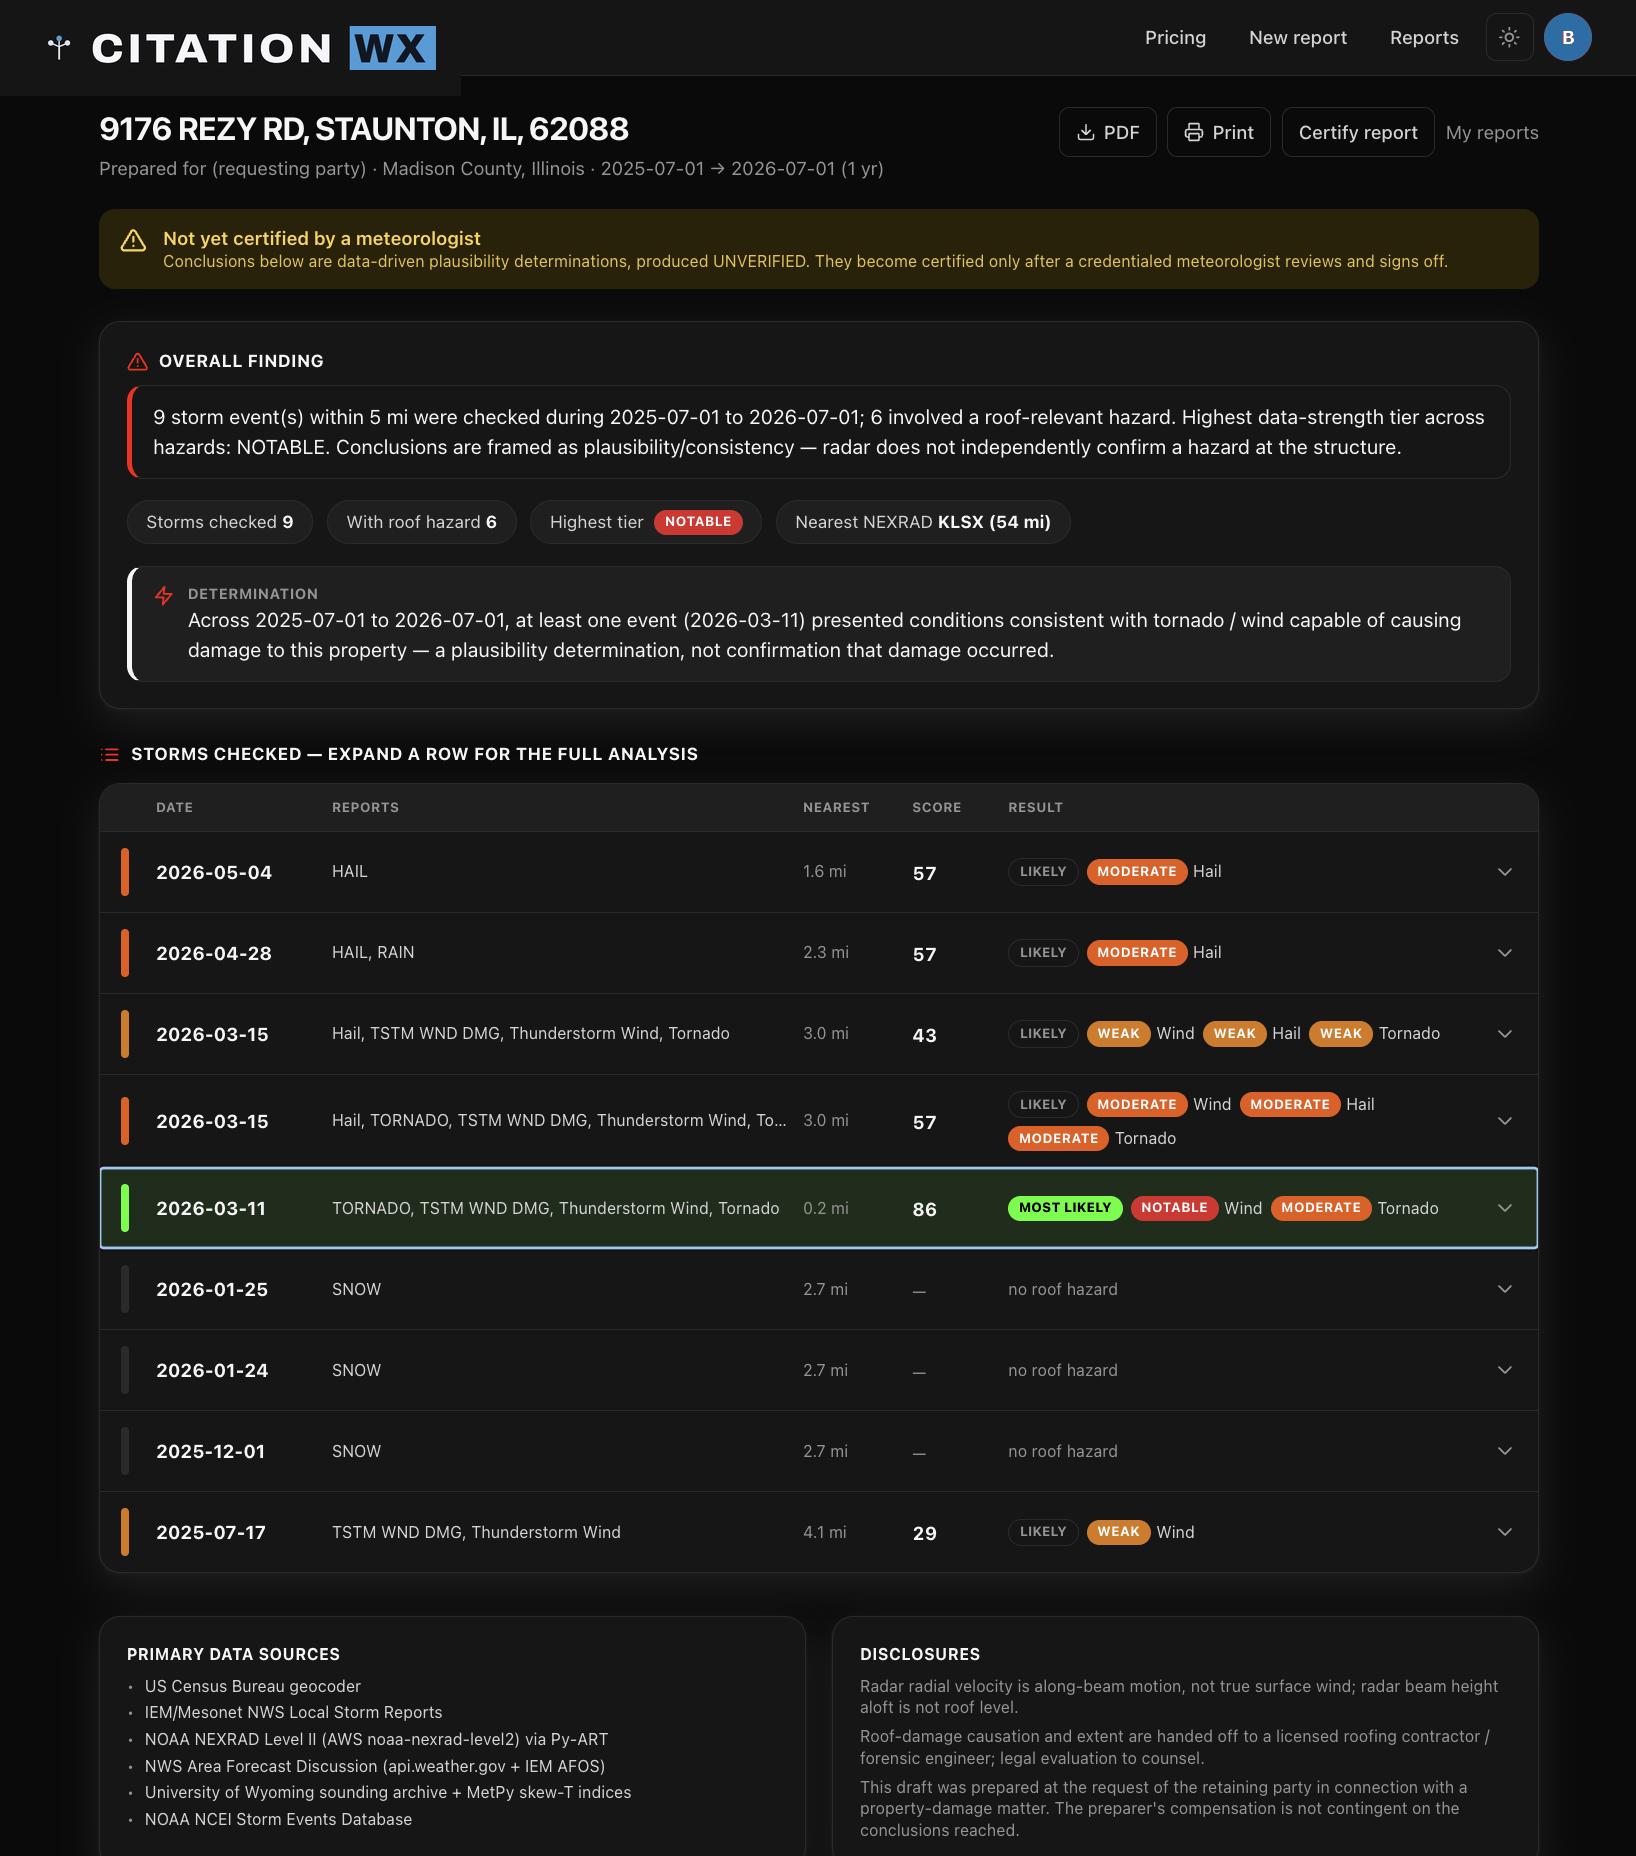
A data-support finding up top, then every storm in the window scored by hazard with expected magnitude and confidence — the strongest event surfaced first. Each row expands into its own analysis.
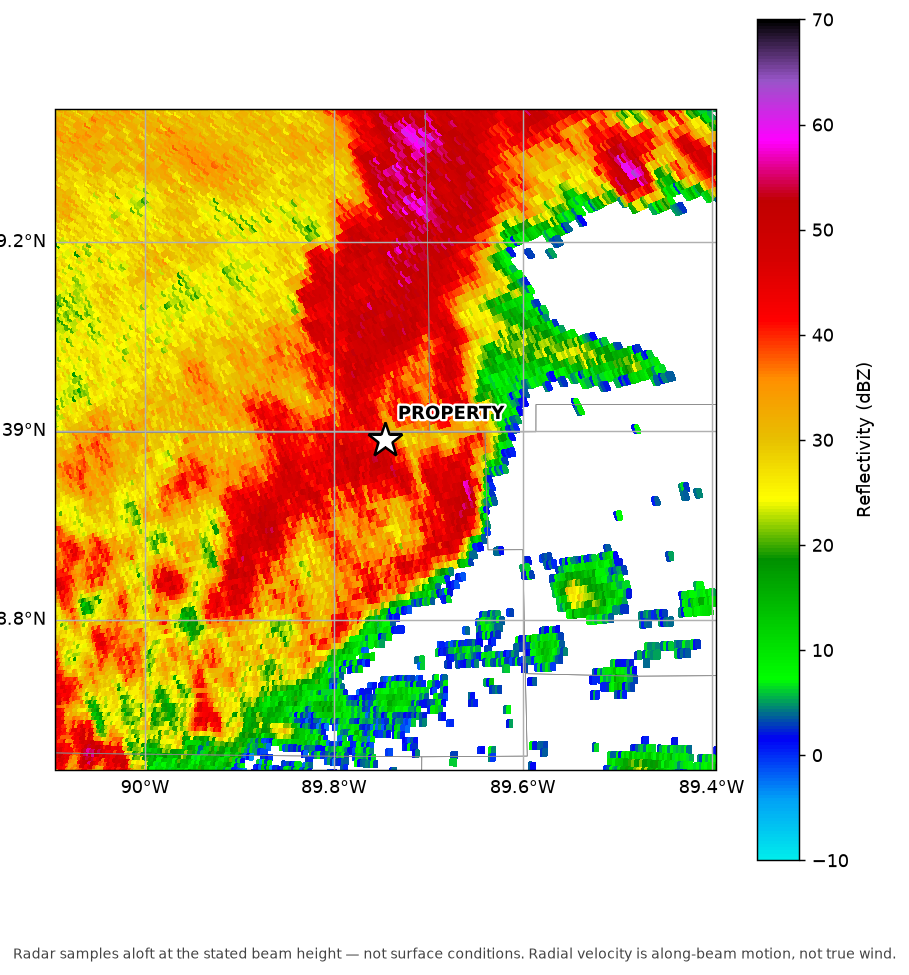
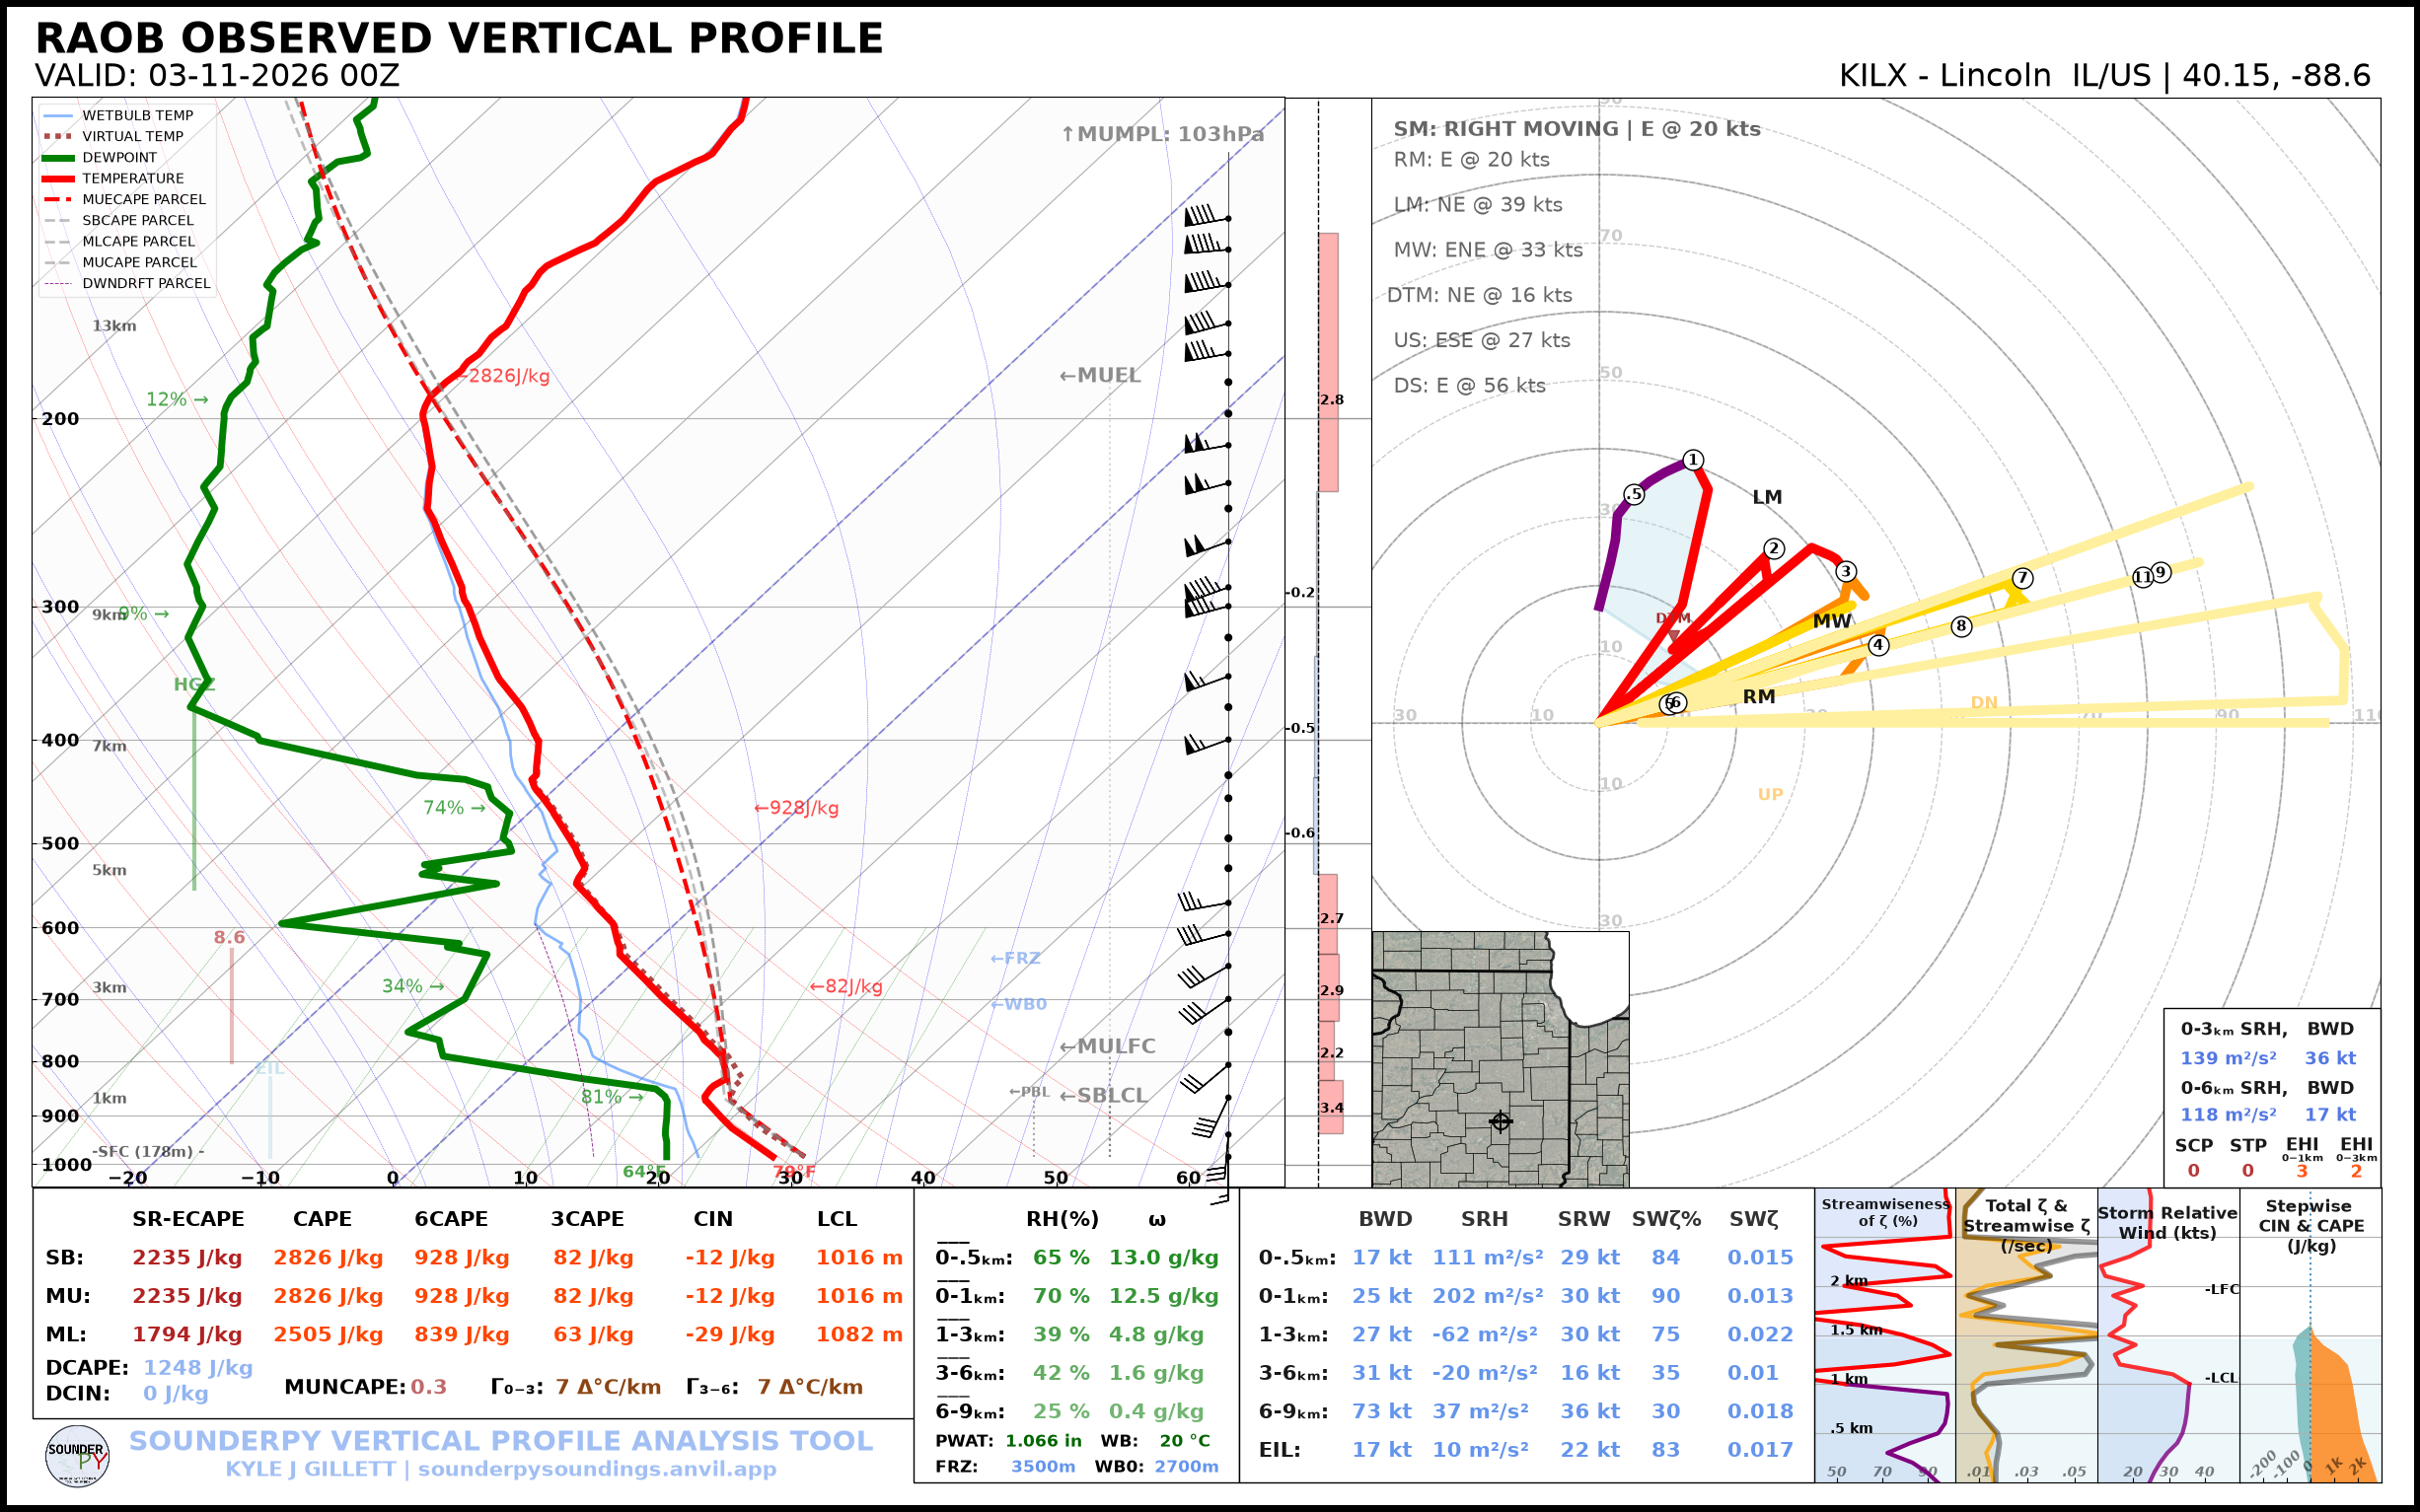
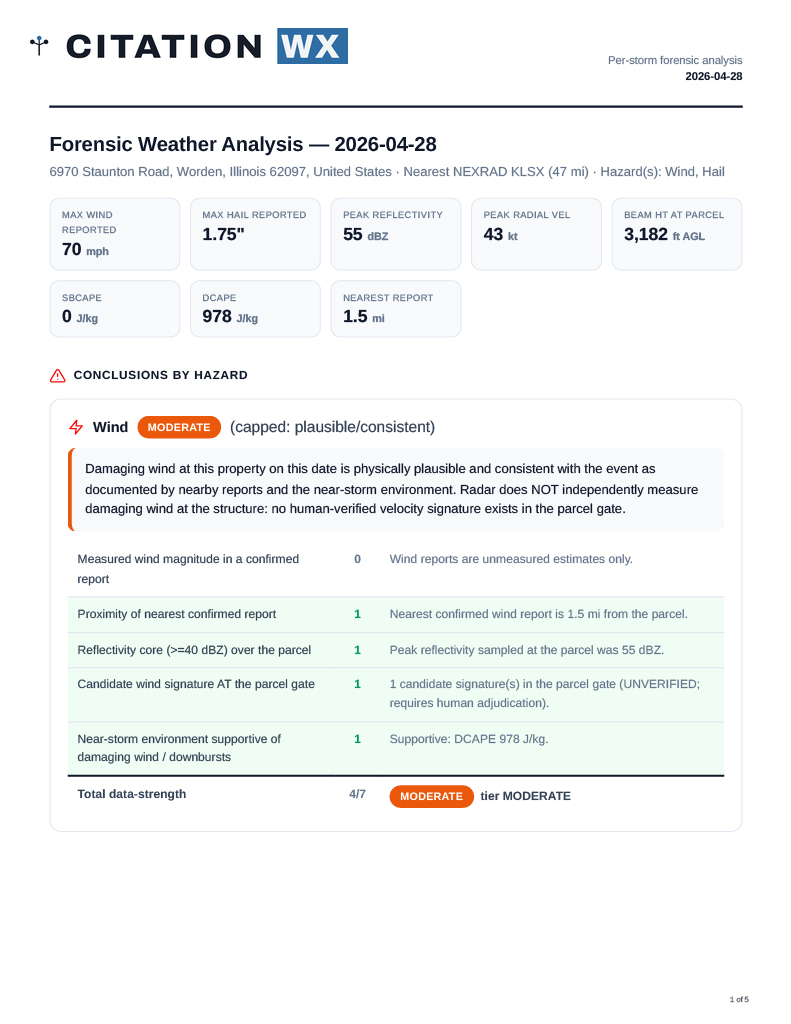
Findings by hazard · radar at the parcel · skew-T & near-storm environment · official storm reports · disclosures.
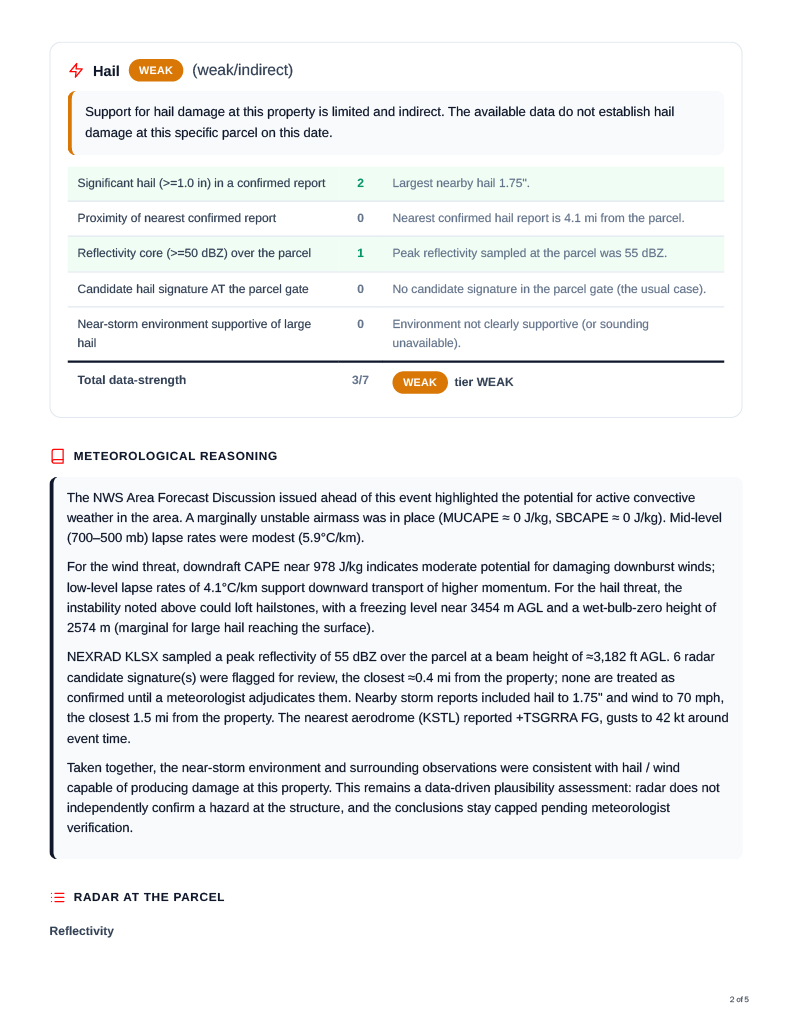
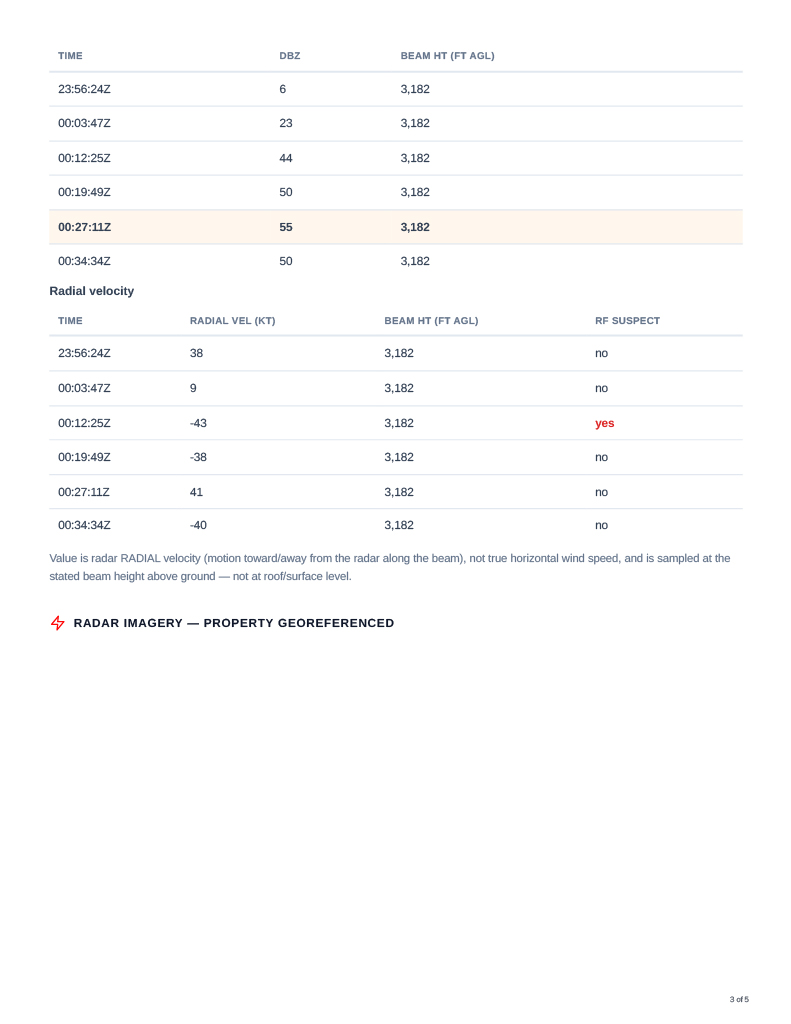
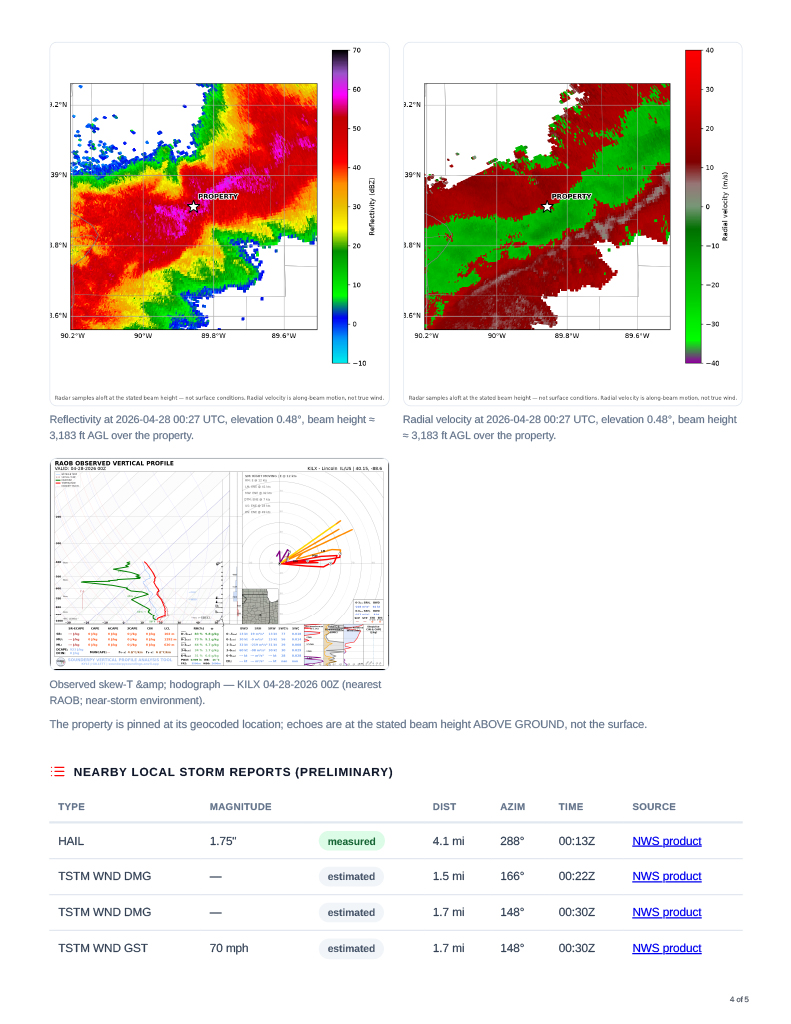
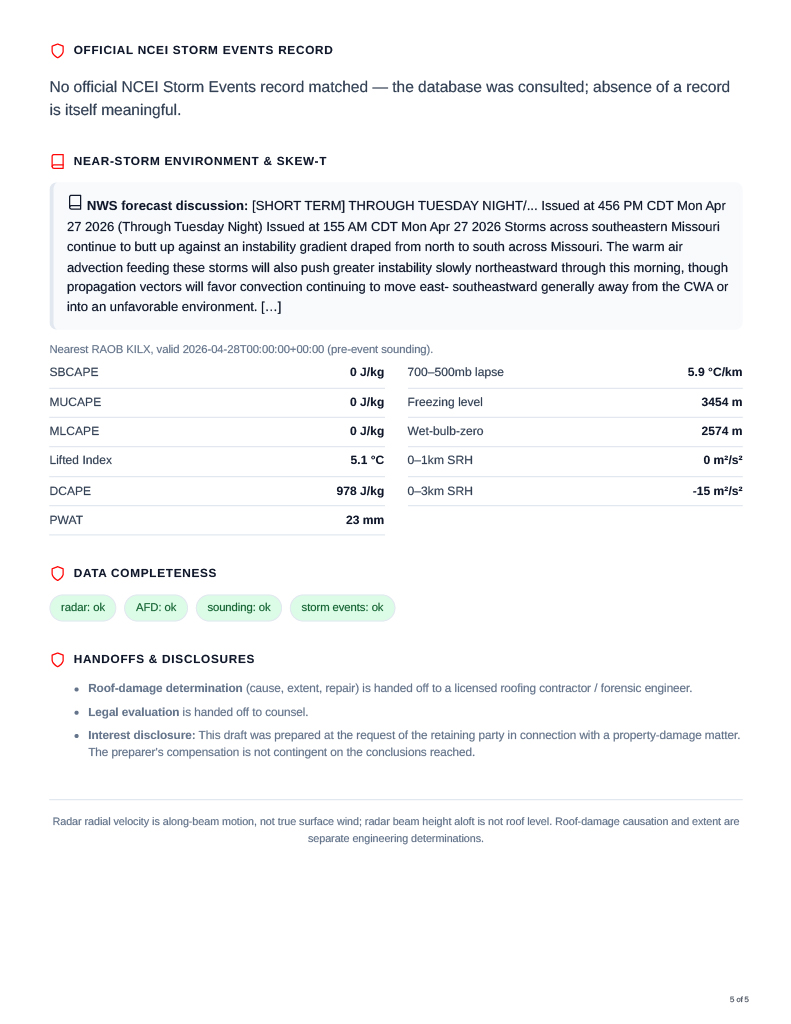
An interactive report, with the raw data behind it.
Every Detailed Analysis opens in the browser, where you can move through each storm's evidence, pull the underlying source files, and request a meteorologist's sign-off.
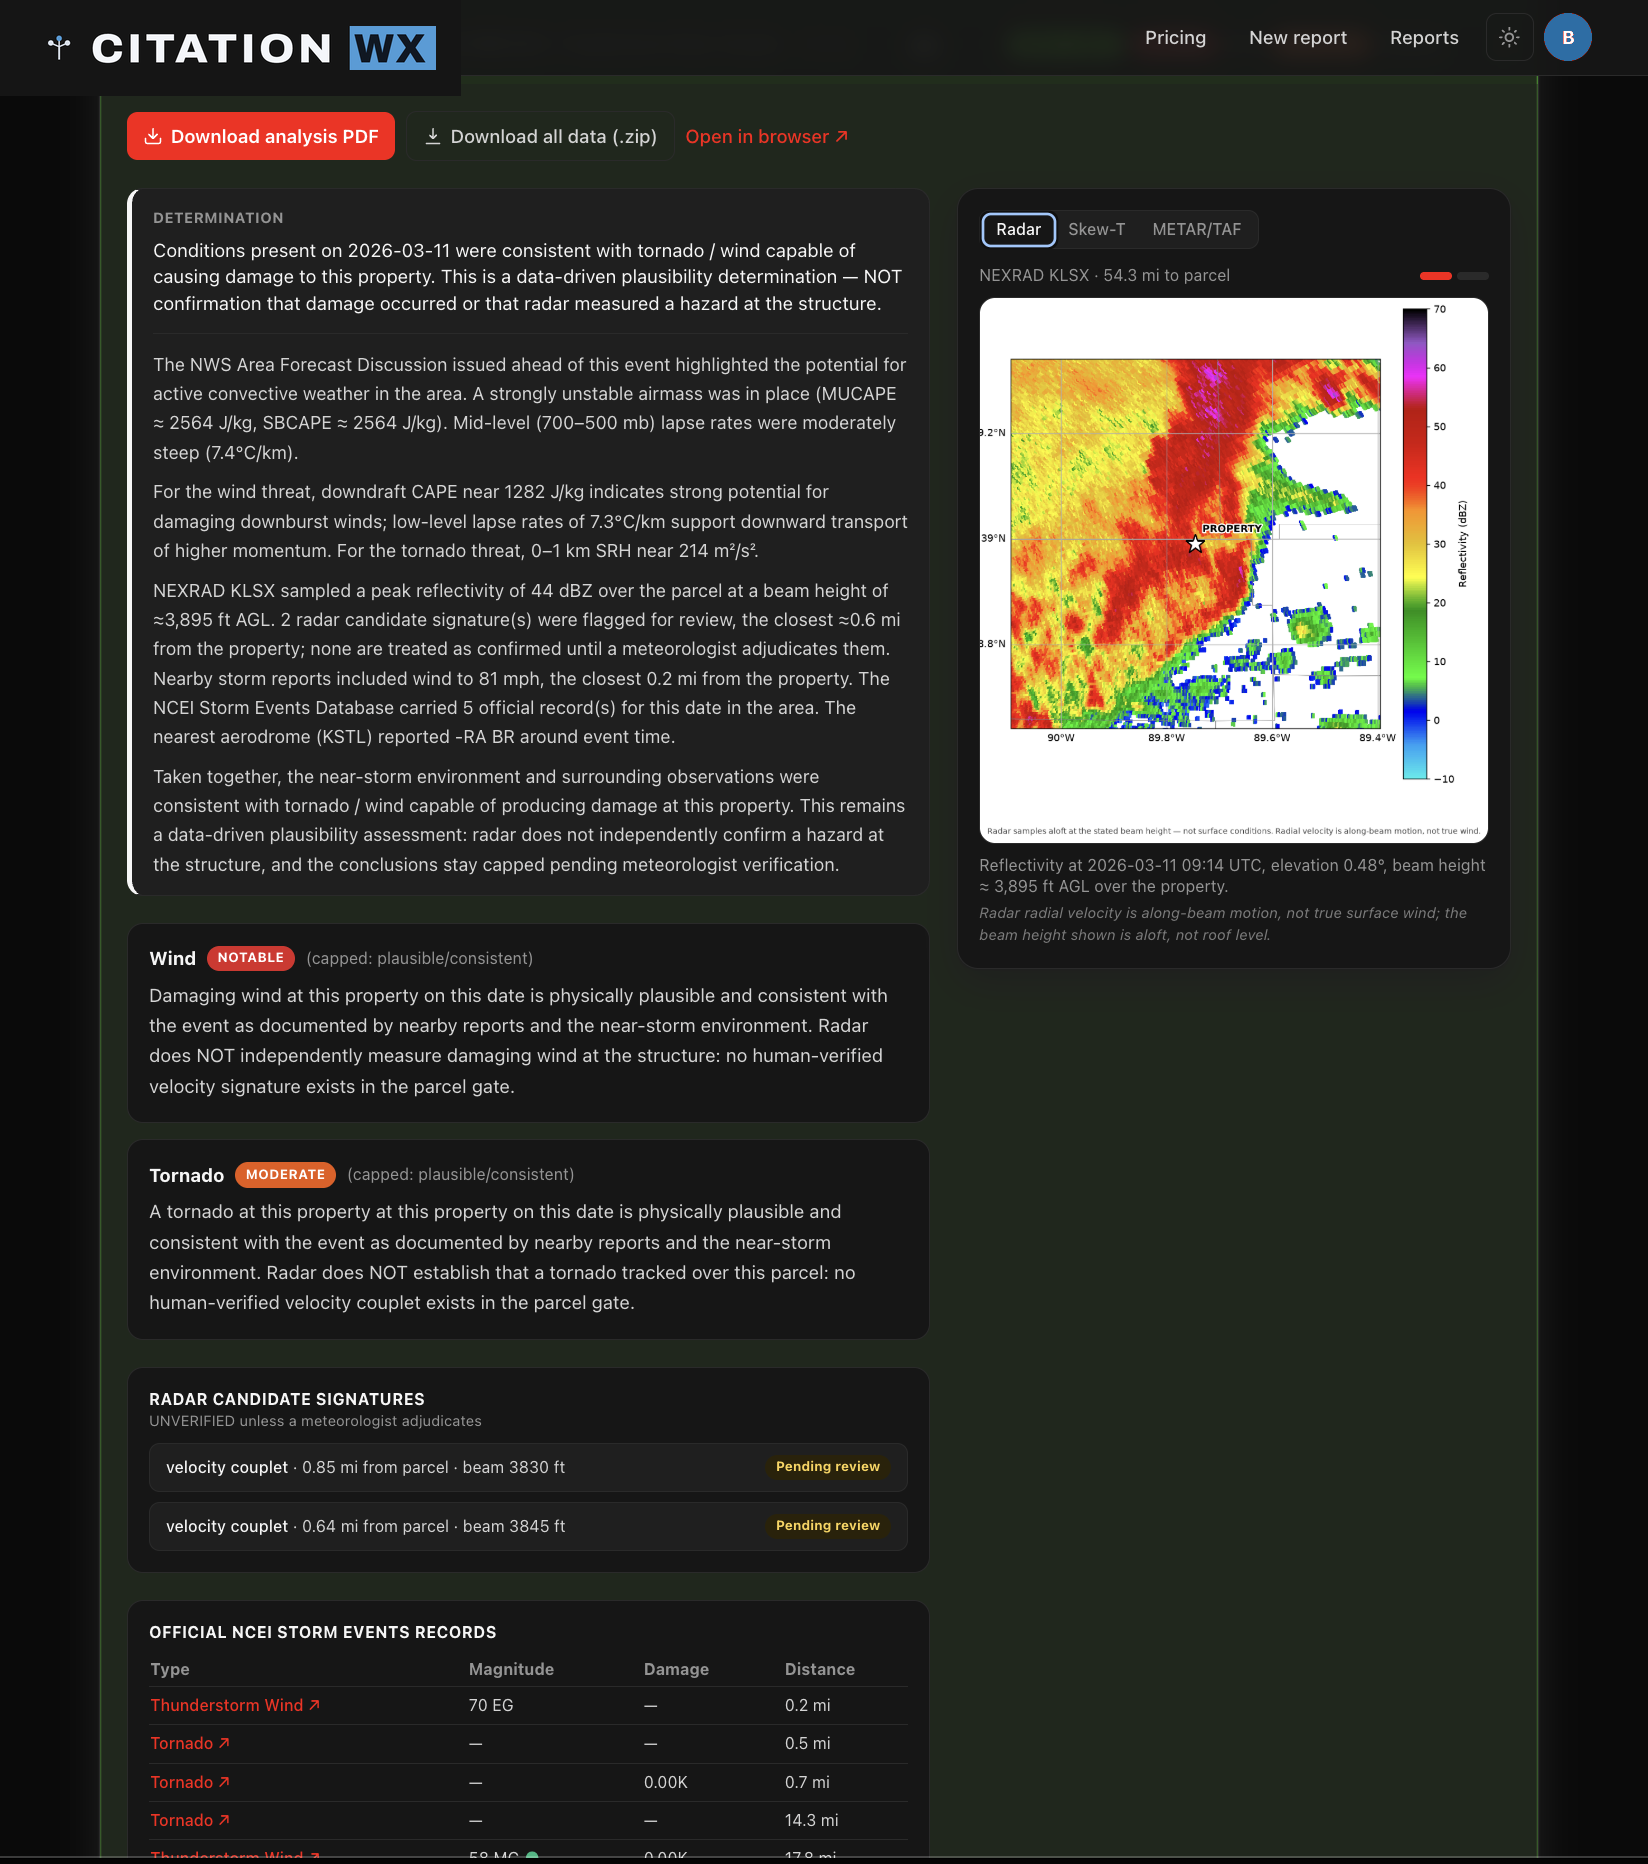
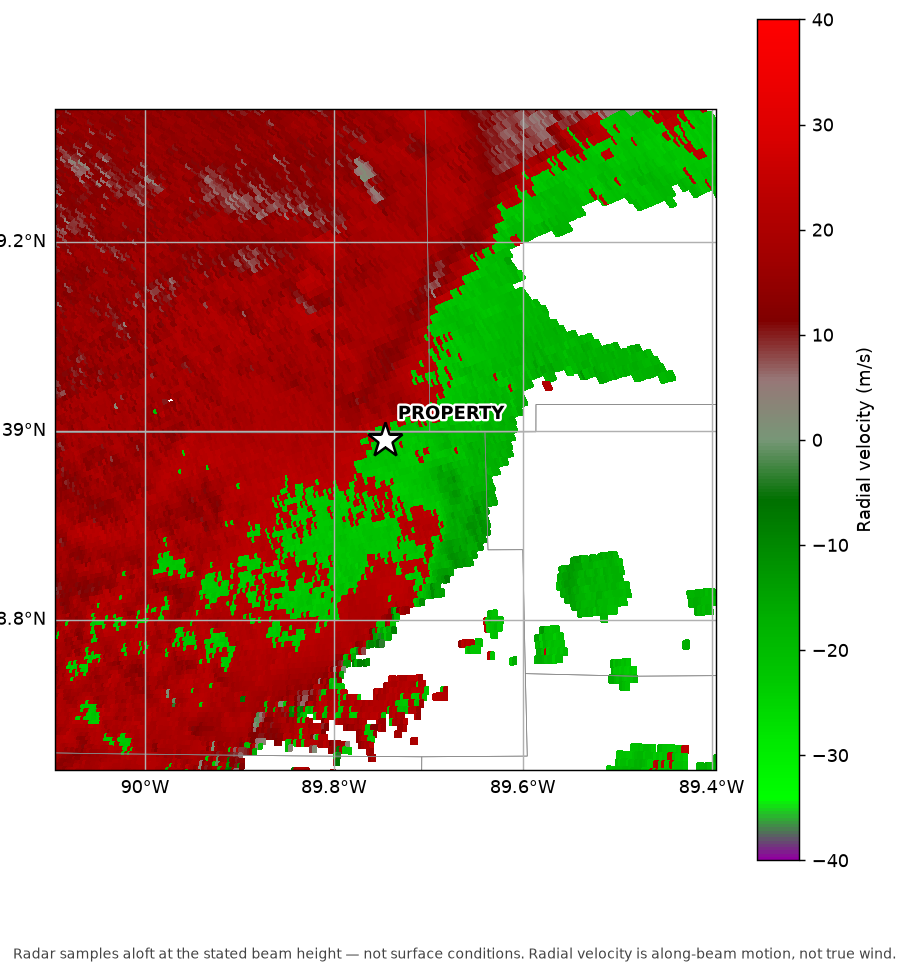
Expand any storm and tab through radar reflectivity and velocity, the skew-T sounding, and METAR/TAF — alongside the findings and official storm reports.
Export the analysis PDF, or pull the evidence bundle as a .zip — including the skew-T soundings and raw NEXRAD Level II (.V06) files behind the analysis.
Conclusions ship UNVERIFIED — data-driven plausibility findings. One click requests review by a credentialed, named meteorologist who reviews, annotates, and signs the report.
We evaluate every storm the way a career meteorologist would.
Our automation works top-down — building a situational picture from the synoptic scale, down to the mesoscale, and finally to the microscale over the parcel itself.
The continental pattern — fronts, upper-level flow, and the airmass that set the stage for the day.
Instability, shear, and the boundaries that organize convection near the address.
What radar, velocity, and nearby reports show in the parcel vicinity — labeled as estimates, not at-address measurements.
Every product is weighed with meteorological reasoning — with particular consideration for the forecast guidance issued before the storm. The result is a thoroughly analyzed storm, evaluated by a model trained on how career meteorologists reason through the same data — and clearly marked UNVERIFIED until one reviews it.
Observations first, forecast guidance second.
We retrieve every relevant weather product, leaning hardest on direct observations — then factor in the pre-storm forecast guidance a meteorologist would consult.